
One of the myths media keep repeating is that global warming entails a warmer and nicer weather. We should soon be able to grow grapes in Northern Siberia. In fact, the IPCC says weather will be more unpredictable, with heavier precipitation than normal several places, drier in other places. Global warming impacts the poles, and the Arctic as well as the Antarctic are losing ice. This inevitably has consequences for global wind patterns. The Polar Vortex is weakened, with further consequences in polar and temperate zones.

Heavy snow in Southern Norway Jan 2014
Global warming is a long-term trend of increasing global average temperature. We still have weather, which causes fluctuations around a rising trend line. Those who live in areas with distinct seasons are well aware of this. A new season brings a much faster change than global warming does. The principle is the same. In the spring, a cold front may cool the weather a week or two. But most people realize, however, that summer is coming. The cooling period is just a skip down for a while before we get back to a rising temperature after the trend line.
Average monthly temperatures may vary from one year to the next by 5-6 degrees. This is weather variation. Global average temperature increase is roughly 0,02° C per annum, or almost 0,2° C per decade for the time being. That is the climate trend. This is why you should not confuse weather with climate. When you want to take a closer look at climate trends, you go to the baseline: the Normal, and compare average weather over at least five years to this baseline. Any period shorter than this is weather variations and not climate. –The Normal is calculated for a period of 30 years.

Source: Cowtan and Way
Annual temperature variations are variations in weather. Climate is average parameters over 30 years. Focusing on one year is unscientific cherry-picking https://www.skepticalscience.com/cowtan_way_surface_temperature_data_update.html
Remember that you observe the weather at only one place on a big planet. In general, most of the planet is warmer than usual. Here is a map of deviations from the norm:

NOAA National Climatic Data Center, State of the Climate: Global Analysis for February 2013, published online March 2013, retrieved on March 29, 2013 from http://www.ncdc.noaa.gov/sotc/global/.
Global Temperature and Precipitation Maps January 2015
Temperature anomalies May 2013 | Temperature anomalies November 2013 | NOAA: Global Analysis – Annual 2014 (Jan 2015) | NASA Climate | NASA: 2013 Continues Long-Term Warming Trend (Jan 2014) | Believe it or not, January was full of big, warm climate anomalies (Feb 2014) | Temperature anomalies January 2014 | Temperature anomalies Dec 2014 | Jan 2015 | Why global warming does not necessarily result in warmer winters (Economist March 2015) | ‘A Harbinger Of The Future’: Climate Scientists Respond To Boston’s Record-Breaking Snow Season (March 2015)| World Needs Early Warning of Climate-Linked Disasters (March 2015) | Must see video: How can it be so cold if there’s global warming? (Jan 2016) |
Note the polarisation between North America and Europe/Siberia in December 2013. Eastern Russia was unusually warm, the USA and Syria unusually cold. This situation lasted well into 2014.

This map for December 2015 depicts a warmer world
Worrying is a distinct cooling just south of Greenland. This is connected with extra large supplies of fresh water from Greenland’s melting glaciers.

This map depicts average temperature deviations over the year 2015.
An ever cooler sea area at the southern tip of Greenland indicates a disturbance of the thermohaline circulation and might be a symptom of a weakening of the arm of the Gulf Stream running north towards Norway and the Arctic Ocean.
Read more on the thermohaline circulation
Note that these maps give an overview of the temperature deviations compared to the 30-year normal. The map shows the difference between the current temperature and the long-term average temperature. Red fields are areas warmer than average, blue fields are colder.
There are more red than blue fields. It is the same almost every month: patterns of red and blue may shift, but it is almost always more red than blue. The planet warms up. If you are in a blue zone this month, it is easy to say: “It’s cold outside! Global warming is nonsense “. But then you are staring at the weather, and do not see climate.
Our atmosphere is a complex, dynamic system. In recent years, a new phenomenon has created unexpected temperature effects. Generally, winds around the North Pole keep the cold air in place around the polar areas. A new pattern called the Arctic dipole, has emerged. This is probably due to the recent massive loss of sea ice in the Arctic Ocean.
Are We Doomed To Arctic Winters In America? (Popular science 2014)
When the system enters the Arctic dipole mode, warm air from temperate zones blows towards the Arctic, while cold polar air go south to replace it. This exchange of air masses creates the ironic situation that areas in the north may experience particularly warm periods, while areas further south, especially eastern North America and Western Europe, may have episodes of unusually cold winter.
“The decline in sea ice and snow cover has slowed the west-to-easterly component of the jet stream, thereby enhancing the north-to-south waviness of the jet, which leads to the creation of more stagnant or “blocked” weather patterns. In addition, the new study found an association between sea ice and snow cover decline and a northward shift in the jet stream, which allows more warm air to move into the U.S. and Europe during the summer. Paradoxically, other studies, including work by the same team of researchers, has shown that Arctic warming can actually enhance cold weather extremes in the U.S. and Europe during the winter” .
It is important to remember that global warming means more evaporation from the oceans to the air. More moisture in the air means more precipitation. As long as the temperature remains below 0 ° C, this precipitation will be coming as snow. In North Western Europe and the North East of the USA, this means global warming causes more rain and more snow but gradually shorter winters.

Heavy snow must be expected in the Nordic countries
Periods of heavy snow must be expected in the Nordic countries and parts of North America for several years ahead. The winter periods will become more erratic, with unusual mild periods in between cold periods. There will be more warm records than cold records. More icy roads for longer periods are likely.
In detail, it appears that the following happens:
Rising temperatures and a warmer Gulf stream give melting sea ice in the Arctic, especially in summer.
When satellite measurements began in 1979, summer sea ice covered about seven million square kilometers, an area almost as large as Australia. In September 2012, the summer ice at its lowest ever, only 3.4 million square kilometers. Sea ice cover will of course vary with weather from year to year, but the trend is clear: Arctic sea ice volume goes down, and summer sea ice cover calculated over decades will clearly diminish drastically. The mechanism is something like this: Remove the reflective ice and you have a dark sea that absorbs solar radiation, which in turn enhances melting, and so on.
NASA: Arctic land ice | Arctic sea ice | ESA: Arctic ice shrinking in volume, too | NOAA: Arctic report card | Massive Antarctic Glacier Has Entered Irreversible Melt (Jan 2014)

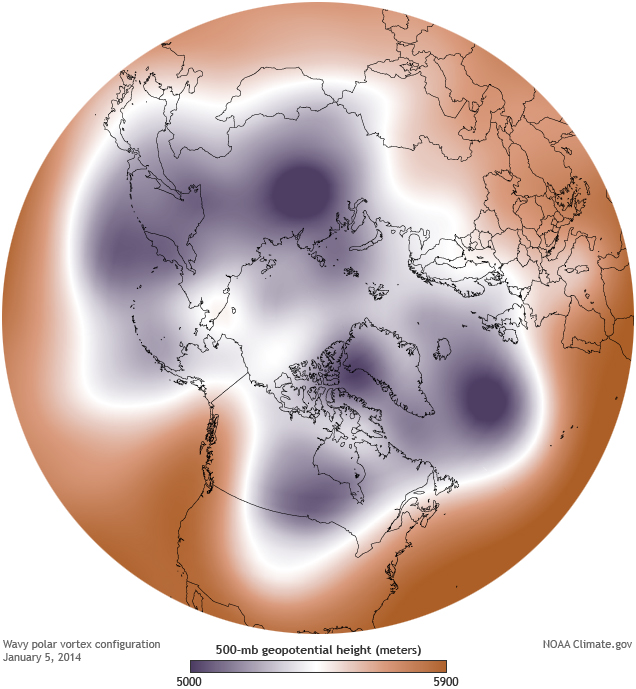
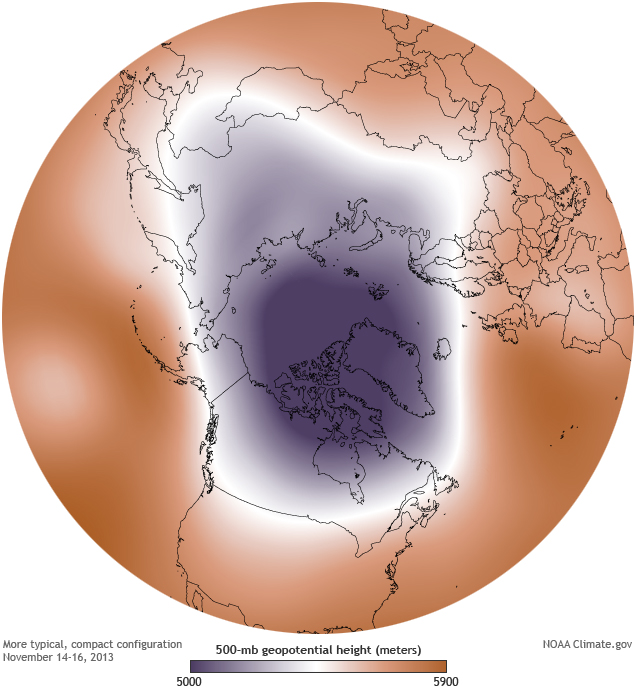
The Arctic vortex – a circumpolar wind – may change with global warming
Maps show the 500-millibar geopotential height (the altitude where the air pressure is 500 millibars) on January 5, 2014 (left), and in mid-November 2013 (right). The cold air of the polar vortex is purple. Maps by NOAA Climate.gov, based on NCEP Reanalysis data from NOAA ESRL Physical Sciences Division. Large images January 5 | mid-November 2013
As a growing part of the Arctic Ocean becomes ice-free, relatively warm surface water spread over an increasingly larger area. This extra heat is gradually released into the atmosphere in the fall. This warm, moist air increases the air pressure and humidity in the Arctic, which reduces the temperature difference at lower latitudes. This means that the polar vortex, a powerful circular air, which keeps the Arctic air in place at the North Pole, begins to fade. This in turn leads to damp, cold air seeking southward, taking snow and colder weather to North America and Europe up to several weeks on end.
Note: In winter time, in cold periods, the sea ice may cover unusually large areas because of the extra amount of surface freshwater from the melting glaciers on Greenland, and extra surface freshwater from the Russian and Canadian rivers. Global warming gives more precipitation, and increases the amount of water in the northbound rivers. However, this is thin winter ice. The total volume of the Arctic sea ice is going down dramatically. More icebergs in the ocean on the other hand, indicate warmer weather, because icebergs come from calving land based glaciers.
The key is to look at the temperature of the entire planet over time. When some areas are unusually cold, this does not mean that the planet has cooled. This means that air masses have changed direction, presumably as a result of sea ice loss due to man-made warming. Even under extreme Arctic dipole periods, there are more areas that are warmer than normal, than regions that are colder than usual.
Global warming can lead to cold spells:
- Why global warming does not necessarily result in warmer winters (Economist March 2015)
- New York Gov: Incoming Monster Blizzard Is Part of a Pattern We’ve ‘Never Seen Before’ (Jan 2015)
- National Academies: A Discussion on Climate Change: Evidence and Causes (March 2014) |
- Is Weird Winter Weather Related to Climate Change? (March 2014)
- Global Warming, Winter Weather and the Olympics – Five Leading Climate Scientists Weigh in (Feb 2014)
- Polar Vortex Brings Dangerous Cold Temperatures To Midwest (Jan 2014)
- Wobbly polar vortex triggers extreme cold air outbreak (NOAA, Jan 2014)
- Believe it: Global Warming Can Produce More Intense Snows (Jan 2014)
- Why Don’t Global Surface Temperature Trends Match Atmospheric CO2 Increases?
- Cold as Hell: The Chilling Effect of Global Warming
- Everything You Wanted to Know About the ‘Polar Vortex’ That’s Engulfed Much of N. America with Freezing Temps
- “It’s cold out today! I guess that pretty much blows the global warming theory.”
- Dear Donald Trump: Winter does not disprove global warming
- A Closer Look at Cold Snaps and Global Warming
- Here’s What These Record Low Temperatures Say About Global Warming (Huffington Post, 2014)
- Does cold weather disprove global warming?
-
The Jet Stream: How Its Response To Enhanced Arctic Warming Is Driving More Extreme Weather
- Study: Arctic Sea Ice Loss Shifts Jet Stream, Driving Deluges In NW Europe, Drought In Mediterranean
- Local is not global. Pockets of cold in a warming world
-
Scientists link frozen spring to dramatic Arctic sea ice loss
- 2013 Wintertime Arctic Sea Ice Maximum Fifth Lowest On Record
- IPCC: North Atlantic Oscillation and Polar vortex |
- Annular modes and circulation changes
- Hansen, Sato & Ruedy (2014) Global Temperature Update Through 2013
.
.Warming pause?
- 15 Things You Should Know About the Major New Report on Climate Science
- Who created the global warming “pause”?
- The world is hottest it has been since the end of the ice age – and the temperature’s still rising (Independence, 2013)
- Jones, Phil (2013) Global temperature records, CRU information sheets
- IPCC: Climate
- It’s hard to sea but the globe is still warming
- Cooling Pacific has dampened global warming, research shows
- 20th Century Temperatures the Hottest in 1400 Years
.
The Arctic and the Antarctic
- Arctic sea ice melts at alarming rate
- Arctic sea ice loss
- Norwegian met office: Sea and ice monitor
- Massive Antarctic Glacier Has Entered Irreversible Melt (Jan 2014)
- Why Antarctic Sea Ice is GrowingStudy Adds to Arctic Warming, Extreme Weather Debate (Dec 2013)
- Arctic ice shrinking in volume, too: ESA (Sep 2013)
- Study: Arctic Sea Ice Loss Shifts Jet Stream, Driving Deluges In NW Europe, Drought In Mediterranean
- Arctic Temperatures Reach Highest Levels In 44,000 Years, Study Finds
- Antarctica is Sliding Sideways Due to Ice Loss
- Arctic news
- Thinning out on Antarctica
- The Jet Stream: How Its Response To Enhanced Arctic Warming Is Driving More Extreme Weather
- Scientists Predicted A Decade Ago Arctic Ice Loss Would Worsen Western Droughts. Is That Happening Already?
- Like Butter: Study Explains Surprising Acceleration Of Greenland’s Inland Ice
- Say goodbye to the Arctic ice
- Possible arctic methane releases called ‘economic time bomb’
- Shipping has already quadrupled this year through the melting Arctic
- The where and when of wetter and drier: disappearing Arctic sea ice plays a role (Feb 2014)
.
More erratic and extreme weather
- It’s just a natural variation, isn’t it?
- Climate change – facts and figures
- Global warming & Climate change – the big picture
- Hansen, J. (2013) Doubling down on our Faustian bargain
- Stand by for another DECADE of wet summers, say Met Office meteorologists
- IPCC: Is the Current Climate Change Unusual Compared to Earlier Changes in Earth’s History?
- NOAA climate
- NOAA: The Keeling curve
- NOAA: Arctic report card
- NASA: Climate
- Scientific American: extreme weather events series
- Typhoon Haiyan – Was That Huge Storm Caused by Climate Change?
- 2013 in review: a year of increasing extreme weather events. John Vidal looks back at a year of record heatwaves, floods, rainstorms and cyclones (Guardian, Dec 2013)
- Climate Change This Week: The Good, The Bad, The Old, The New in 2013, and More!
- The effects of climate change: Storm damage in Europe on the rise (Swiss re)
- Ocean Toastiness Sending Fish Fleeing for the Poles
- Extreme heat waves to quadruple by 2040, study says
- Two or three degrees more – does it matter?
- Australia Heat Wave Sets Records Across Continent (Jan 2014)
- Check out this shocking map of California’s drought (Jan 2014)
- National Academics / National Research Council: Climate change – lines of evidence video series
- New Research Confirms Global Warming Has Accelerated
- NASA: 2012 the 9th warmest year on record
- Solar activity heads for lowest low in four centuries
- Is a mini ice age on the way? Scientists warn the Sun has ‘gone to sleep’ and say it could cause temperatures to plunge
- NASA: the nine warmest years on record have occurred since 1998
.
Oceans
