
Norsk
More than 90 million barrels of oil every day In addition roughly the same amount in coal and gas.
We humans burn between 85 and 100 million barrels of oil every day. One barrel of oil equals 159 litres, roughly a full bathtub. This corresponds to 14 310 000 000 litres of oil every day
Every day we burn a corresponding amount of coal and gas. If we add the coal, oil and gas, it corresponds to burning an olympic sized swimming pool filled with oil every second, 24/7 year round.

Carbon everywhere
Full size image Source: UNEP/GRID-Arendal
Oil, coal and gas are fossil fuels which nature has stored in the ground for the last 400 million years. Now we take this carbon from its storages in the ground and put it back into air and sea over a period of two centuries . This fossil carbon is not part of the daily or the annual carbon cycle where all living organisms breathe, and plants produce oxygen and sugar through photosynthesis. Our burning of fossil fuels adds extra carbon to the carbon cycle that is already, naturally present.
- Oil market report
- Daily crude oil prices
- International Energy Agency (IEA)
- IEA Key world energy statistics
- OPEC statistics and projections
- OPEC: World oil outlook 2012
- EIA International energy statistics
- EIA international energy statistics – world
- IEA -Key World Energy Statistics 2015
- IEA world energy outlook 2015
- The world’s biggest oil producers
- The world’s biggest oil exporters
- The World’s Largest Oil And Gas Companies 2017: Exxon Reigns Supreme, While Chevron Slips (Forbes, 2017)
- Crude Oil Exports by Country (2017)
- Most of the world’s countries could run on 100% renewable energy by 2050, says study (WEF, 2017)
- Carbon everywhere
- The carbon cycle (NASA)
- The slow carbon cycle (NASA)
- The fast carbon cycle (NASA)
- Changes in the carbon cycle (NASA)
- Effects of changing the carbon cycle (NASA)
- Nature (2014) Carbon is forever
.
USD 20 -120 per barrel The open market price for one barrel of oil. Oil is sold by barrels: bbl.
If we take the daily 90 million barrels and multiply by USD 100, we get a rough idea about the global daily economic turnover of crude oil: we get USD 9 000 000 000. And this is just the crude oil. In addition we get the different layers of daily turnover of the value adding chain of tanker transport, refineries, refined petroleum products sold at retail prices. (Gasoline, diesel, kerosene, asphalt etc). In addition you add the daily economic turnover of coal and gas with corresponding figures). According to some sources the global daily turnover of fossil fuel related products is somewhere around USD 200 billion.
The owners of the top highest oil producers and exporters belong to the superrich less than 1% class. The 10 richest companies in the world, most of them oil companies, are all bigger economies than 180 countries. Arab-American oil company (Aramco) is assumed to be the world’s most valuable company, with capitalisation over a trillion dollars, twice or more as wealthy as Exxon-Mobile and Apple. The combined wealth of Aramco and its partners (the gigantic oil companies from the oil cartel called “seven sisters“) is one of the biggest economies of the world, if not the biggest.
- The world’s 25 biggest oil companies (Forbes)
- The World’s biggest oil companies (Forbes 2012)
- Exxon reports record profits (CNN money2012)
- Saudi Arabia blocks climate change from UN poverty goals
.
USD 500 – 2000 billion per year in subsidies
“Fossil fuels remain dominant in the global energy mix, supported by subsidies that amounted to $523 billion in 2011, up almost 30% on 2010 and six times more than subsidies to renewables” IEA (2012) World energy outlook | IMF Experts and Others Envision a World without Energy Subsidies. IMF calculates real subsidies to fossil fuels to be USD 2 trillion annually
A recent projection places the total value of conventional global fossil fuel subsidies between $775 billion and more than $1 trillion in 2012, depending on which supports are included in the calculation.1 In contrast, total subsidies for renewable energy stood at $66 billion in 2010” World Watch institute: Fossil Fuel and Renewable Energy Subsidies on the Rise The International Monetary Fund is deeply worried about the fossil fuel subsidies: Energy subsidy reform | IMF Rejects Fossil Fuel Subsidies, Calls for Reform | What if solar got fossil fuel subsidies
.
36 billion tonnes CO2 per year
The production of extra CO2 as an inevitable result of burning fossil fuels is over 35 billion tonnes of annual emissions of carbon dioxide added to our common atmosphere. This CO2 does not just vanish. Some of it is absorbed by vegetation and seas. Some of it remains in the atmosphere for centuries. CO2 emissions 2006
.
40% increase the last 200 years
The last 10000 years the CO2 content in the atmosphere has been roughly 270 ppm. The last one million years, the CO2 content has probably not exceeded 300 ppm. The atmospheric CO2 content has increased rapidly since the start of the industrial revolution in 1750. The increase is now accelerating, and has now temporarily now passeds 400 ppm. After 2017 it is unlikely that the CO2 content will ever drop below 400 ppm. In human perspective, this is passing a point of no return.
- NOAA – Mauna Loa
- Keeling curve
- Keeling curve daily update
- IPCC: CO2 content
- UNEP: GHG concentrations record high
- We Just Hit Another Scary Climate Change Milestone – Keeling curve passed 400 ppm (April 2014)
. 1 808.0 ppb – 158% increase of methane
The atmospheric content of the strong greenhouse gas methane in the year 2010. This is 158% higher than it used to be hundred and fifty years ago.
- The global climate 2001-2010 (WMO, 2013)
- Fracking and methane – gangplank to a warm future
- We’re Looking at the End of Humanity — And It Might Happen Sooner Than You Think
- Methane Levels going through the Roof
- The Climate Time Bomb That Will Cost Us $60 Trillion
- Vast costs of climate change in the Arctic (Nature, 2013)
- The tipping point in action: twice as much methane released due to seabed permafrost melting
- Last hours (on the methane feedback mechanism)
- Last hours website
- The ‘Ticking Time Bomb’ That Could Cause Such Rapid Global Warming We’d Be Unable to Prevent Extinction
- Researchers say Arctic Ocean leaking methane
.
0,17% of the climate researchers in doubt
The number of climate researchers who question anthropogenic global warming is a fraction of one percent. A climate researcher is a person who is academically qualified as a researcher in the topic area and who has recently published his or her findings in a peer-reviewed, international, scientific journal. The scientific consensus is massive. Scientifically there is no debate on the anthropogenic impact on our climate systems. During the last 50 years there has been no extra insolation. There is no special Milankovich effect warming our planet. Extra cosmic dust does not have any special impact on our climate.
- Ring, M, et al (2012) Causes of the global warming since the 19th century
- Quantifying the consensus on anthropogenic global warming in the scientific literature
- The scientific consensus on climate change (AAAS)
- IEA statement on climate change (Dec 2012)
- Cosmic rays and global warming
- Understanding and attributing climate change (IPCC,2007)
- Explaining climate science
- Clouds over peer review
.
2°C
In the Copenhagen accord 167 countries agreed that to avoid reaching dangerous tipping points, global warming should not exceed 2 centigrades. Unfortunately, the two degree target is no guarantee against a runaway greenhouse effect. Some people think this goal is probably impossible to keep, and that it is a cover-up. The two-degree limit is more based on political negotiations than on science. The scientific majority prefers a less than one-degree rise in global average temperature to feel safer. Risking a one degree rise might be similar to playing russian roulette with one bullet in the magazine. A two degree rise might be equal to loading it with two bullets. Another degree means a third bullet load. You point your russian roulette gun at your grandchildren. The likely outcome is “Hell and high water” in our childrens’ lifetime. The worst case scenario is the Venus syndrome.
.
565 Gigatons
Scientists have calculated that there is a reasonable hope to stay below 2°C by mid century if we limit our carbon emissions to a total of 565 more gigatons, or corresponding to less than 450 ppmv of greenhouse gases(GHG) in the atmosphere. (This is probably wildly optimistic. The atmospheric CO2 content is now over 390 ppmv, while the total concentration of atmospheric GHG is already over 470 ppmv).
2795 Gigatons
The amount of carbon contained in the proven oil, coal and gas reserves of fossil fuel companies – the fossil fuel we currently plan to burn – is 2795 gigatons. This is five times more than our “allowance”. Global warming’s terrifying new math
- Unburnable carbon: wasted capital and stranded assets
- The unburnable carbon
- The Grantham institute on the climate and the environment
- Unburnable fuel (Economist)
.
5% increase in atmospheric humidity per 1°C increase in global average temperature
Warmer oceans and air means increasing humidity in the air. Firstly, water vapor is the main GHG. More humidity is an enhancing feedback mechanism. Secondly, more water vapor in the air means heavier rainfalls and floodings
- IPCC, 2007
- Extreme weather
- Filipino super-typhoon an ominous warning of climate change impact
- Global warming accelerating
- Extreme weather means extreme planning
- Water vapour – a greenhouse gas
- Water Vapor Confirmed as Major Player in Climate Change (NASA)
- How much more will Earth warm? (NASA)
.
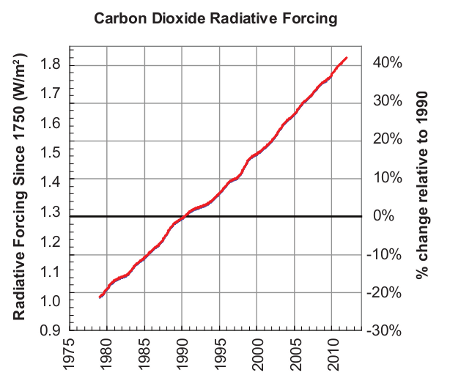
30% increase in radiative forcing since 1990
National Oceanic and Atmospheric Administration’s Annual Greenhouse Gas Index (NOAA-AGGI), shows that from 1990 to 2011, radiative forcing by long-lived greenhouse gases increased by 30%, with CO2 accounting for about 80% of this increase
- | IPCC Synthesis report 2014 | U.N. Panel Issues Its Starkest Warning Yet on Global Warming (NYT Nov 2014) | IPCC synthesis report for policy makers 2014 |
- IPCC (2013) The Physical Science Basis
- IPCC: Climate Change 2014: Impacts, Adaptation, and Vulnerability
- IPCC (2014) Mitigation of climate change
- NASA Study: Climate Sensitivity Is High So ‘Long-Term Warming Likely To Be Significant’ (March 2014)
- National Academies: A Discussion on Climate Change: Evidence and Causes (March 2014)
- WMO, 2012: Greenhouse gas increase reaches new records
- UN/Greeningtheblue
- Dramatically warmer world this century, World Bank 2012
- NOAA (2012) Arctic report card
- State of the climate report 2012 (NOAA, Jan 2013)
- NOAA Climate
- NASA Climate time machine
- Hansen, Sato & Ruedy (2013) Global temperature update through 2012
- Makiko and Hansen: Updating the climate science
- The scary graph getting scarier (March 2013)
- US scientists report big jump in CO2(March 2013)
- CO2 not the only driving force
- Greenhouse-gas emissions raise extreme temperatures in China (April 2013)
0,16ºC
Global average temperature increase per decade is less than one fifth of one centigrade – so far. Per annum the average temperature rise is slightly more than one hundredth of one degree. Annual weather variations will obviously have much stronger impact than global warming – for the time being. An increasingly open Arctic sea will have impacts on North Atlantic climates. “The period 2001–2010 was the warmest decade on record since modern meteorological records began around the year 1850. The global average temperature of the air above the Earth’s surface over the 10-year period is estimated to have been 14.47°C ± 0.1°C. This is 0.47°C ± 0.1°C above the 1961–1990 global average of +14.0°C and +0.21 ± 0.1°C above the 1991–2000 global average. It is 0.88°C higher than the average temperature of the first decade of the 20th century (1901–1910). A pronounced increase in the global temperature occurred over the four decades 1971–2010. The global temperature increased at an average estimated rate of 0.17°C per decade during that period, while the trend over the whole period 1880–2010 was only 0.062°C per decade. Furthermore, the increase of 0.21°C in the average decadal temperature from 1991–2000 to 2001–2010 is larger than the increase from 1981–1990 to 1991–2000 (+0.14°C) and larger than for any other two successive decades since the beginning of instrumental records. Nine of the decade’s years were among the 10 warmest on record. The warmest year ever recorded was 2010, with a mean temperature anomaly estimated at 0.54°C above the 14.0°C baseline, followed closely by 2005. The least warm year was 2008, with an estimated anomaly of +0.38°C, but this was enough to make 2008 the warmest La Niña year on record. The 2001–2010 decade was also the warmest on record for both land-only and ocean-only surface temperatures. The warmest worldwide land-only surface-air temperature was recorded in 2007, with a temperature anomaly of +0.95°C.” WMO (2013) The global climate 2001-2010)
- Global Temperature in 2018 and Beyond (2019)
- IPCC (2007): Observed changes
- Global average temperature
- Winter analysis 2012/13
- How do human activity contribute to climate change?
- James Hansen: Game over for the climate
- The truth about climate change (Hansen)
- Projections of future changes
- The escalator
- NASA climate
- NASA: key indicators
- NOAA: Climate monitoring
- It’s just a natural variation isn’t it?
- Winter is cold – global warming canceled?
- You can’t deny global warming after seeing this graph (Washington Post July 2013)
- The global climate 2001-2010 (WMO,2013)
- 15 Things You Should Know About the Major New Report on Climate Science
- Who created the global warming “pause”?

Source: Cowtan and Way
Annual temperature variations are variations in weather. Climate is average parameters over 30 years. Focusing on one year is unscientific cherry-picking https://www.skepticalscience.com/cowtan_way_surface_temperature_data_update.html
0,76°C
The world’s oceans are warming. Average ocean temperatures have risen by 0,76°C the last century
- World’s oceans are getting warmer, faster
- Ocean temperatures (UOCS)
- Sea temperature rise (NG)
- Warmer oceans (EPA)
- It’s hard to sea but the globe is still warming
- Oceans Face Triple Threat Of Warming, Declining Oxygen And Acidification, Study Shows
. 4°C – the likely increase this century
According to a World Bank director and chief economist Sir Nicholas Stern, his so-called Stern report from 2006 was wrong. The situation is far more serious IPCC 2007: The long term perspective
473 ppm GHG
Total radiative forcing of all long-lived greenhouse gases was the CO2 equivalent of 473 parts per million in 2011 (Greeningtheblue, 2012).
Total GHG radiative forcing since 1990
Source: NOAA, Global Monitoring Center 2012
This leads to a clear long-term warming trend Escalator: Average of GISS, NCDC, and HadCRUT4 monthly global surface temperature anomalies 1970-2011
- World Bank (2012): Our planet on path to four degrees warming
- NASA Climate time machine
- NASA climate
- NASA (2012) reduced polar ice coverage
- National academies press (2012) seasonal and decadal predictions of Arctic sea ice
- Global temperature
- Five shots against global warming denialism
- Climate risks have been underreported the last 20 years
- Get used to record-breaking heat
- 2012 the hottest year since 1895
- If you aren’t alarmed about climate, you aren’t paying attention
- Climate change is simple
- Where greenhouse gases come from
- Temperatures to rise six degrees in the Middle East
- Oceans warming up 700 m below surface
- Antarctica Melting Brings Expanded Sea Ice Extent
- Global warming predictions are accurate
- It’s time to accept the facts about climate change and move on (Scientific American 2013)
- Delaying action on emissions will increase costs and reduce chances of limiting temperature increase (Nature 2013)
- 20th Century Temperatures the Hottest in 1400 Years
- Climate change: evidence, impacts and choices (NRC)
.
3,18mm per year
The average global sea level rise by 3,18mm per year – and the rise accelerates
- NASA climate
- How much is sea level rising?
- Sea level rise (Scientific American)
- Sea level rise (Environmental research)’
- Surf’s way up
- Unabated global mean sea-level rise over the satellite altimeter era (Nature, May 2015)
- Ice melt, sea level rise and superstorms: evidence from paleoclimate data, climate modeling, and modern observations that 2◦C global warming is highly dangerous
3.489.063 square kilometres
The Arctic sea ice extent autumn 2012. On September 16th the trend line shortly dipped below 3.5 million km2, reaching a minimum extent of 3.489.063 square kilometres. That’s more than three quarters of a million below the 2007 record, and more than a million below 2011.
- Arctic sea ice volume 1979-2012
- Arctic sea ice extent 2012/13
- Arctic sea ice news and analysis (NSIDC)
- Arctic sea ice blog
- NOAA Arctic report
- NASA land ice report
- Arctic sea ice is getting thinner faster than expected (March 2015)
- NASA: 2015 Arctic sea ice maximum is lowest recorded (March 2015)
- Are You Ready for the Biggest Environmental Catastrophe of Our Lifetime? West Antarctica melting (April 2015)
- Arctic sea ice melts at alarming rate
- Arctic sea ice loss (video)
- Arctic summers could be nearly ice-free in seven years
- New Satellite Data Reveals Dramatic Shrinkage of Arctic Ice Cap (Feb 2015)
- Glacial melting inn Antarctica Makes Continent The ‘Ground Zero Of Global Climate Change’ (Feb 2015)
30-fold
Shipping along the Arctic northern sea route is set to grow more than 30-fold over the next eight years
- Ice levels, rule changes to boost Arctic northern sea route
- Shipping has already quadrupled this year through the melting Arctic
30%
The oceans have become 30% more acidic the last century. 1/4 of the extra CO2 humans add to the atmosphere is absorbed by the oceans. This leads to acidification of the oceans, and threatens the marine eco systems.
- Scientists Focus on Polar Waters As Threat of Acidification Grows (April 2014)
- NOAA: acidification
- Acidification international network
- Ocean acidification: global warming’s evil twin
- Arctic ocean acidification
- An Upwelling Crisis: Ocean Acidification
- Ocean Acidification Happening at 10X Rate Than Ever Before – Study
- ‘The Other CO2 Problem’: How Acidic Oceans Will Cost Our Economy Billions (Oct 2014)
. Less than $ 1
The cost of one Watt of solar energy is now less than one dollar, and is competitive with electricity from coal and oil. The cost of solar energy is sinking, the cost of fossil fuels is rising.
- Graph comparing costs of solar energy with coal and oil
- Renewable energy
- Renewables 100 policy institute
- 100% sun, wind, and water can power each U.S. state and the world –Stanford study |
USD XXX million petro dollars to denial and propaganda
The economic interests in keeping the fossil fuel society going for some more years are so high that the richest people in the world are willing to take unethical and extreme risks. They keep funding the biggest propaganda machinery ever seen
- Documenting the Fossil Fuel Industry’s Climate Deception (Union of concerned scientists July 2015)
- The Climate Deception Dossiers (Union of concerned scientists July 2015)
- Scurvy Story: Why You Should Believe 97% Of Climate Scientists, Not Long-Wrong John Christy (Feb 2014)
- Secret funding helped build vast network of climate denial thinktanks
- The ATM for climate deniers
- ‘Reality Drop,’ Climate Change Social Media Website Unveiled By Al Gore, To Take Down Deniers
- Misunderstanding Of Climate Change Concepts May Be Stalling Global Action
- The climate change deceit and conspiracy theories
- Desmogblog
- About the climate cover-up
- Climate change denials is just hot air
- Five shots against global warming denialism
- Myths on the urban island heat effect
- Koch Brothers Political Empire Holds Action on Climate Change Hostage
- Kochs Form New Dark Money Group To Hide Political Activities From Public
- The 10 richest companies in the world 2012 |
- Charles and David Koch |
- The Number of Billionaires Is Growing Across the Planet, as Global Inequality Spreads
- Meet The Saudi Prince Who Finances the Murderous Egyptian Military, and Crushes Democracy in the Middle East
- The Prince: Meet the Man Who Co-Opted Democracy in the Middle East
- Stripping the “climate realists”
- Kritikk av klimapanelet uten substans
- How to argue with “sceptics”
- Why USA and Canada refuse to kick their fossil fuel addiction
- How the religious right fuels climate change denial
- Don’t let clean energy naysayers deny us hope
- How human stupidity destroys the world
- Greedy, lying bastards
- Skeptical science getting skeptical about global warming skepticism
- Some scientists have always been willing to prostitute themselves for good payment | Advertisements
- Climate change deniers
- How the Fossil Fuel Industry is Subverting Democracy and Undermining Sustainable Development in America
- Saudi Arabia blocks climate change from UN poverty goals
- 99 One-Liners Rebutting Denier Talking Points
.
The main problems with the fossil fuel society
Most countries currently depend on oil, gas and coal as energy sources. More than 80% of the world’s energy is obtained from fossil fuels. The reasons are high energy density, abundance and until now relatively low costs. The problems can be divided in four categories:
- Environmental pollution
Coal and oil contain many different chemicals and particles that may be hazardous to health, such as carbon particles, NOx, VOCs; and harm the environment, such as sulphur. Burning coal kills. Oil spills may have serious longterm toxicological effects. Coal mining and tar sand oil exploration destroy nature
.
- Non-renewable, limited resources
Fossil fuels are finite. Sooner or later the resources will run out. We use the cheap and easily available sources first. We get “hooked” and addicted. When the source peaks (about now), more expensive and less readily available sources will be exploited – and the products sold to a much higher retail price. The profits for persons controlling old and cheap oil-wells will be staggering.
.
- Vulnerable logistics and volatile prices, uneven geographical distribution The big reserves of cheap, conventional crude oil are concentrated in the Middle East, controlled by “Big oil” CEOs in association with regimes or persons with agendas of their own. Extreme islam = petro-islam= “beduin”-islam = wahhabists and salafists. The most fanatic are apocalyptic mahdis, and like some extremist christians and jews they are looking forward to and promote the apocalypse.The one reason wahhabists and salafists are counted in millions rather than thousands is oil. This is a main reason why ordinary muslims fighting for democracy in Tunis, Egypt, Syria etc have a hard and long struggle ahead of them. Petro-islam and Western big oil CEOs to a large extent control and instruct US big oil and their propaganda machinery. They instruct Rupert Murdochs media empire and Fox news. They increasingly buy Western banks. Fossil fuel societies are vulnerable to delivery failure and wild price fluctuations. Fossil fuel societies depend on the good will of corpocratic groups like Big oil and petro-tyrants.
.
- CO2 emissions and climate change Climate scientists worldwide have documented the evidence of global warming in surface air, land and sea temperatures, the rise of sea level, reductions in glacier ice and snow coverage, increase in ocean heat content and ocean acidification
- State of the climate report, NCDC/NOAA
- CICERO
- NASA
- CRU
- Royal society
- IPCC
- WMO
- UNEP
- Bjerknes centre
- Munich re climate
- UK met office & Hadley centre
- Met office
- EU – EEA
- WRI
- World Bank
- PriceWaterHouseCooper (2012) Low Carbon Economy Index – planning for a warmer world
- KPMG climate change and sustainability
- SKANSKA environmental responsibility and carbon reduction
- NOAA (2012) Arctic report card
- Hansen, J. (2012) Climate change is happening now – a carbon tax must follow
- West Antarctica warming twice as fast as previously believed
- China the biggest polluter
The new paradigm: renewable energy sources and sustainable development
a. Renewable energy does not pollute air and water b. Renewable energy is eternal c. Renewable energy increases local resilience and robustness, keeps capital at local leves, decentralises logistics, increases innovation and local competence, stops capital accumulation in the wrong places, facilitates and enhances democratic processes. d. Renewable energy prevents global warming and ensures a safer and prosperous future for future generations
- The fight between dirty energy dinosaurs and clean-tech mammals
- Why Dirty Fossil Fuel Barons’ Power and Wealth May Be Reaching its Limits
- There’s Only One Real Option for Averting Economic and Ecological Ruin — So Why Aren’t We Talking About It?
- Bloomberg: renewables set to triple by 2030
- 100% renewable energy possible
The risk of choosing the sustainable development paradigm is having to pay some extra money for a much better and safer future for all. We are all more or less petroholics. The sooner we start weaning ourselves off the habit, the better. The choice is yours – and many factors indicate you have to choose now.
-
- The Stern review: The economics of climate change
- Unburnable carbon: wasted capital and stranded assets
- The unburnable carbon
- The Grantham institute on the climate and the environment
- The economists in Wonderland
- Green eco economy
- The sustainable society of 2040
- How we can prevent catastrophic climate change with a clean energy revolution.
- What Will It Take for Us to Recognize That the Way We Live Could Be Destroying Life as We Know It?
We should have started transforming our society forty years ago. The longer we wait, the more expensive it will be. We have known what to do for decades. Margareth Thatcher on global warming 1990 GET IT DONE! More extensive URL collection

Pingback: Out of fossil fuels now! | Education for Sustainable Development