
Scientific skepticism is healthy. Researchers should always challenge themselves to improve their understanding. But climate deniers are not there. With weak roots in scientific facts they throw out allegations, speculations and unfounded criticism of evidence supporting anthropogenic global warming. Uncritically they embrace any argument, conspiracy theory or propaganda that refutes global warming. The propaganda often refers to individuals having written an article in a newspaper or on a blog claiming that we are entering a new ice age or that New York will be under water in the year 2017 or that the Arctic will be ice free in 2018 or that the Greenland glaciers will be gone in 2020 and the world go under in 2050. If such claims were at all made by scientists, it is ridiculous to deduce that the entire scientific community should support one article, even if it had been peer reviewed and published in a scientific journal. The only publications that to some extent may claim to represent the scientific community are the IPCC reports, since they summarize thousands of scientific publications in five year periods.
Retired professors in the United States are paid to produce seemingly scientific information in newspaper articles and create myths for extreme think tanks and PR companies, funded by the international fossil fuel industry.
When in doubt, it is wise to follow the big money.
The age of fossil fuels will soon end. We need to plan the transformation now.
The world’s largest exporter of fossil energy is President Putin. The world’s richest company; the Arab-American Oil Company, Aramco, is owned by the wahabbist Saudi royal family. With their partners; ExxonMobil, Shell and other oil companies previously called “The seven sisters“, they form the world’s largest economic entity.
Carbon barons, extreme Islamist petro-tyrants and corrupt oligarchs will do anything to prolong the oil era.
Knowing the economic and hegemonic interests at stake, one should be wary of those who support them. Do their arguments have scientific basis? Is the article peer reviewed? The graphics, are they “embellished”? Is the article in reality unscientific speculation with possible referral to sources produced by Arab-American-Russian fossil propaganda industry?
With unlimited amounts of petro-dollars backing them, the “skeptics” still fool people into inaction. Gullible politicians have an enormous responsibility. Not only are they complicit in prolonging unnecessary air and sea pollution, promoting wars and financing most of the terrorists and petro-tyrants in the world. They risk stealing the very future from today’s children. The only ethically responsible stand now is to ensure that fossil fuels are used to produce renewable sources of energy as fast as possible. Fossil fuels can be perceived as the “parents” of renewables. As good parents, they should step aside for their “offspring” during the coming decade. In 10-15 years we should no longer burn oil, but just use it as a valuable resource.
Conspiracy theory about the UN
International fossil industry propaganda spreads several myths. One such myth is the conspiracy theory that the UN and tens of thousands of scientists and politicians have agreed to scare people so they easily accept more taxes.
Thousands of the world’s foremost scientists meet annually at climate summits. They discuss and argue about everything, down to commas. But they, allegedly, in some strange way, continuously manage to agree to deceive the media and defraud people, even if hundreds of new researchers join every year. IPCC associated scientists build their reports on over 30,000 peer-reviewed articles published in the world’s most prestigious scientific journals. The IPCC reports summarize some of the best science ever presented.
One needs to have a lot of good, naive faith – or be well paid – to believe in such conspiracy theories.
The skeptics’ null hypothesis
The climate deniers’ null hypothesis: “There is no relationship between greenhouse gases in the atmosphere and climate change”, was refuted already in 1863, when J.Tyndall proved the greenhouse effect experimentally and in 1896 when S. Arrhenius showed how CO2 in the atmosphere affects the temperature on the ground.
In principle, large gas molecules, as a rule molecules with three or more atoms vibrate in step with the infrared radiation. Gases such as oxygen (O2) and nitrogen (N2) will not react particularly to such radiation, while for example molecules of water vapor (H2O), carbon dioxide (CO2), ozone (O3) and methane (CH 3) will vibrate. Vibration entails heat energy.
You may have been told that CO2 is such a tiny part of the atmosphere that it does not matter. What they “forget” to tell you is that what counts are greenhouse gases, less than 1% of the air. Then CO2 is highly significant. When you are tøld that the natural carbon cycles are so enormous, that anthropogenic emissions are insignificant, they “forget” to tell you that when you move carbon from the “slow carbon cycles” to the “fast carbon cycle“, you bring the natural carbon cycle out of its finely tuned balance. The natural greenhouse effect gives us a comfortable average ambient temperature of + 14 ° C, instead of -18 ° C, which it would have been without the natural greenhouse effect. So far the additional anthropogenic greenhouse effect has only given us one degree in addition to the Earth’s natural 32 degrees. Not so much perhaps, but for a person who gets a rise in temperature from 37 ° C to 39 ° C it means the difference between being healthy and sick. – The world’s politicians want to allow for a two degree temperature rise. Unfortunately, anthropogenic emissions – which we may influence – are not the only factors. The anthropogenic emissions give the triggering forcing. Natural feedback systems, such as increased atmospheric water vapor, carbon dioxide from natural sources, methane emissions from clathrates and melting tundra, will boost the original forcing. The end result might be four or even 6 centigrades increase.

IPCC synthesis report, Figure SPM.3, p.6: Assessed likely ranges (whiskers) and their mid-points (bars) for warming trends over the 1951–2010 period from well-mixed greenhouse gases, other anthropogenic forcings (including the cooling effect of aerosols and the effect of land-use change), combined anthropogenic forcings, natural forcings, and natural internal climate variability (which is the element of climate variability that arises spontaneously within the climate system even in theabsence of forcings).
Many factors affect the climate. Anthropogenic emissions come together with particles; aerosols, which have a cooling effect (except black soot which has a warming effect). Air pollution over Asia, an increasing number of large wildfires and more dust storms in drier areas mean more cooling aerosols over land. Solar insolation over the past decades has been low. Global warming occurs therefore not evenly, but incrementally. It is misleading just to include surface temperatures over land. Ocean temperatures must also be included.
The pet year of the climate illusionists, 1998, was a special year with high solar activity and the strongest El Nino in a hundred years. “It has not been warmer since 1998” it is stated. If you start out in the climate (the normal), rather than weather from one year to the other, and warming of land and ocean, the average temperature rise from decade to decade is clear and dramatic. When data biases are corrected, there is no “warming pause”.
” The average global temperature across land and ocean surface areas for 2015 was 0.90°C (1.62°F) above the 20th century average of 13.9°C (57.0°F), beating the previous record warmth of 2014 by 0.16°C (0.29°F). This is not only the highest calendar year temperature, but also the highest temperature for any 12-month period on record. ”
For the last 50 years, global temperature rose at an average rate of about 0.13°C (around one-quarter degree Fahrenheit) per decade—around twice as fast as the 0.06°C per decade increase observed over the previous half-century. In the next 20 years, scientists project that global average temperature will rise by around 0.2°C (about one-third of a degree Fahrenheit) per decade (NOAA 2016).

id
2015 record hot
2015 has clearly been warmer than 2014, although northern Europe did not have a particularly hot summer. The rest of the world had an exceptionally warm period.
Record warmth was observed over various regions of the world’s land surfaces, including Central America, the northern half of South America, parts of northern, southern, and eastern Europe stretching into western Asia, a large section of east central Siberia, regions of eastern and southern Africa. It was also much warmer than average across many other land areas all across the globe. Only part of Quebec in northeastern Canada and the very southern tip of Argentina were cooler than average. No land areas were record cold or even much cooler than average.
Globally the curve for March 2016 looks like this:
The combined average temperature over global land and ocean surfaces for March 2016 was the highest for this month in the 1880–2016 record, at 1.22°C (2.20°F) above the 20th century average of 12.7°C (54.9°F). This surpassed the previous record set in 2015 by 0.32°C / (0.58°F), and marks the highest monthly temperature departure among all 1,635 months on record, surpassing the previous all-time record set just last month by 0.01°C (0.02°F). Overall, the nine highest monthly temperature departures in the record have all occurred in the past nine months. March 2016 also marks the 11thconsecutive month a monthly global temperature record has been broken, the longest such streak in NOAA’s 137 years of record keeping.

Graphic by Hansen and Sato Aug 2015
- NOAA challenged the global warming ‘pause.’ Now new research says the agency was right (Jan 2017)
- NOAA: Study: Global Warming Hiatus Attributed to Redistribution
“It’s getting colder!” Really?
Climate deniers have for years told us that it is getting colder. As evidence, they’ve made themselves graphics where they cherry pick information that suits them. They avoid telling from where the data set is and how it is interpreted. They give the impression that the graphics come from a reputable institution, while in reality it is not sourced and simply concocted by individuals with their own extremist agenda.

Graphic from Fossil fuel propaganda site
The lower part of this graph is misleading because there is one data set from one satellite only, without any caveats. Cocksure statements based on weak science are typical for the “skeptics”.
Serious climatologists take datasets from three different satellites and add direct measurements from ground stations and in the oceans. The Hadcruth3 satellite data is excellent for its use. But it should not be presented without mentioning its limits. One of the weaknesses is that it does not include measurements from the Polar areas, where the greatest warming is in progress. Satellites take pictures in a belt around the globe, not the entire planet. (Hadcruth official site and with reanalysis data demonstrating that incomplete global coverage is a potential source of bias in global temperature reconstructions.)
For most, it should be sufficient to look out of the window or at the daily weather map to realize that climate change is underway, and that it is very doubtful that the climate would become cooler and more stable. A week or two with cold weather in your place does not mean there is no global warming.
Warming in the world’s oceans is dramatic and disturbing. Sea level rise accelerates. Warming in the Arctic is striking. Ice floe borders in Arctic waters move northwards “by itself”. Extreme weather events are becoming the new normal. Glaciers worldwide melt away except some areas in the Antarctica, where more snow in the cold area is a clear sign of warming. Ice at the South Pole becomes thicker above but melts all the faster from below. All in all the ice loss in the Polar regions is alarming. The year 2014 is the warmest on record. 2015 was even hotter.
“It’s just a natural variation”
The climate is dynamic and has changed tremendously, well before humans existed. IPCC writes entire chapters about this in all major reports. This is a science called paleoclimatology. Through climate models we have gained solid knowledge on what may cause climate change. Most often it is changes in insolation, where the sun is more or less active. It may also be Milankovich effects where planetary positions relative to the sun affect climates.
In earlier times, meteor impacts, large volcanic eruptions, changes in ocean currents and tectonic changes have caused dramatic climate changes. CO2 has usually had an enhancing feedback effect, and not an initiating forcing effect, as is the case now. Most climate scientists agree that when including natural factors only, our planet should have become somewhat colder, since solar activity in recent decades has been low. The horrible anthropogenic air pollution particularly evident in Asia, also has a cooling effect. Despite this, almost all years of this century are as hot or hotter than the record year in the last century, 1998. This can only be explained by human activity. The changes in climate we observe now cannot be explained by natural variations only.

Bloomberg: What’s really warming the world?
Petitions
Thousands of scientists have signed a petition that the UN is wrong, is a frequent postulate. This is an old advertising trick. In ads 50 years ago we were told that 20,000 doctors recommended a particular cigarette brand, that tobacco was good for health, or at least that there was no empirical evidence that it was harmful. Smoking was not addictive, and at least passive smoking was totally harmless.
The same PR firms that “Big Tobacco” used and are using are now paid by “Big Oil” to disseminate the same kinds of deceptions. Petitions often come in the form of surveys that ask whether you believe that CO2 is useful for plants and trees, that climate change took place also before humans existed, that climate change usually is due to natural causes and similar platitudes. Then the PR firms pretend that the IPCC insists that only CO2 can cause climate change, that there never were changes in climate before man intervened, that CO2 is nothing but harmful and similar nonsense. When the names on the petitions are checked, the names are fictional, they are dead, they are unaware that they are on the list or they are not climate scientists.
A climate scientist is professionally qualified as a researcher and publishes in peer-reviewed scientific journals. Here the “skeptics” come woefully short. Less than 1% of peer-reviewed articles dispute anthropogenic global warming. Climate researchers agree that the current climate change is largely man-made; the changes accelerate and already cause major damage. Many climate scientists disagree about the politically approved two-degree target. More and more now say that a two degrees rise is a recipe for disaster, and that one degree rise is very risky.
“CO2 is plant food and not pollution”
The IPCC has many studies on the fertilization effect of CO2 in all major reports. That CO2 may have a positive effect on plant growth is as sensational as telling that water is wet. Much “plant food” is pollution if it lands in the wrong places. Cow dung, urine and sewage are also “plant foods”, but that does not necessarily mean that you want it everywhere and that it is not pollution.
CO2 can have a positive effect on plant growth when other growth factors like optimal temperature, light, enough water and micro nutrients are present. And yes, more CO2 might in some cases make plants more resilient to drought. However, there is no doubt that all the extra energy and CO2 absorbed by the oceans lead to acidification, destroy coral reefs and threaten marine bioproduction.
When fossil fuels are concerned, it is not only CO2 that is the problem. Toxic substances and particles spewed out by any combustion of coal and oil take the lives of millions of people, damage or destroy ecosystems and affect the health of billions of animals and humans. These huge costs are passed on to the public in general. To the desperation of the fossil-industry, alternative renewable, non-polluting energy is economically competitive in ever more areas, even with the current low oil prices.
Climate “skeptics” confuse and spread uncertainty. They create paralysis in order for everything to continue as usual: trillions in subsidies from the world’s taxpayers, socialization of losses, externalization of costs and privatization of profit in the coal and oil industry. To draw attention away from the elephant in the room, they keep on creating quasi-scientific discussions about the Pope’s beard. They holler and point to mouse droppings in the corner and flies in the window. But the elephant is standing there, and more and more become aware of it: the fact that we daily burn over 90 million barrels of oil and an equivalent amount of coal and gas. One barrel of oil is 159 litres, about a full bathtub. Consumption corresponds to burning an olympic sized swimming pool filled with oil every second of the year. One must love illusions to believe that this has no negative effects.
It is irresponsible and unethical to speculate in possible microscopic doubts to refrain from taking sensible action. Municipalities and countries failing to upgrade water and sewage networks, allow for much more floods, droughts, weather extremes and landslides will lose. Those who do not invest in renewable energy and sustainable technology risk being left behind like the old Soviet states, with hopeless Trabant technology, outdated and uncertain economy and a depleted environment.
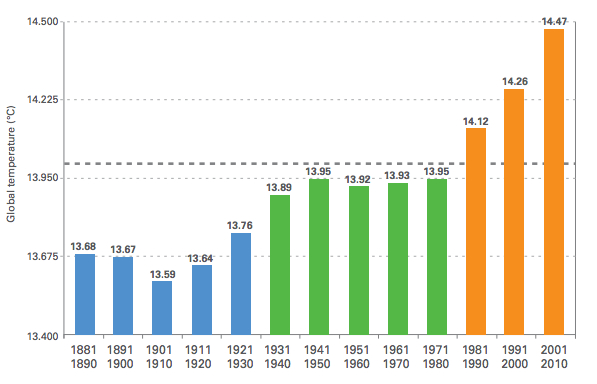
When measuring the average temperature over decades, there is a clear and dramatic warming. Global warming the last three decades has been dramatic. Source: World Meteorological Organisation, 2013
The warming world
- Climate reality project
- Earth Is Experiencing a Global Warming Spurt (Jan 2016)
- What Are The Chances Of Getting All These Record Hot Years Without The Extra Greenhouse Gases? The Answer… (Feb 2016)
- Freak Storms and Butterfly Die-Offs: Welcome to the Future We’ve Been Warning You About. This is your climate on fossil fuels. (Feb 2016)
- Climate change: 2015 ‘shattered’ global temperature record by wide margin (BBC Jan 2016)
- Katharine Hayhoe: Here’s How Long We’ve Known About Climate Change
- 2015 Shatters Hottest Year Mark; 2016 Hot on its Heels?
- A greener future
- Planet or profit?
- 2016 set to be hottest year on record globally
- Global Average Surface Temperature Anomalies (Tokyo climate center 2016)
- December 2015 was the wettest month ever recorded in UK (Jan 2016)
- The oceans are heating up more rapidly than we thought. Why that matters. (Jan 2016)
- The Siege of Miami. As temperatures climb, so, too, will sea levels
- Night of the Living Dead, Climate Change-Style: How to Stop the Fossil Fuel Industry From Wrecking Our World (Jan 2016)
- Our Changing Planet (US)
- Atlas for a changing planet (interactive maps)
- National Geographic’s Stunning Portraits Bare the Stark Reality of Climate Change (Nov 2015)
- Earth’s climate entering new ‘permanent reality’ as CO2 hits new high (Nov 2015)
- Bill Nye Demolishes Climate Deniers: ‘The Single Most Important Thing We Can Do Now Is Talk About Climate Change’ (Nov 2015)
- Short Answers to Hard Questions About Climate Change (NYT Nov 2015)
- A path beyond the climate change talks (NYT Dec 2015)
- Exxon Warns Climate Inaction Risks Warming Far Beyond 2 Degrees (Dec 2015)
- Failing phytoplankton, failing oxygen: Global warming disaster could suffocate life on planet Earth (Science Daily, Dec 2015)
- Top Climate Expert: Crisis is Worse Than We Think & Scientists Are Self-Censoring to Downplay Risk (Dec 2015)
- Possible artifacts of data biases in the recent global surface warming hiatus (Science, June 2015)
- 16 Terms You Need to Know to Understand Climate Change
- Facing the harsh realities: Climate science has been manipulated or ignored by the IPCC, and by leaders meeting in Paris. We are committed to far more than 2 degrees of warming. A vastly changed world awaits. Radio Ecoshock 151118
- Climate Dynamics: Facing the Harsh Realities of Now. Climate Sensitivity, Target Temperature & the Carbon Budget
- The Apollo-Gaia Project – Climate dynamics and facing harsh realities
- NOAA: Hottest Spring and Hottest Year to Date on Record (June 2015)
- 10 indicators that show climate change
- Hansen et al (2015) Ice melt, sea level rise and superstorms: evidence from paleoclimate data, climate modeling, and modern observations that◦C global warming is highly dangerous
- Climate Change 2015: Here’s What NASA Found After 12 Years Of Studying Global Warming From Space
- Hansen, J. (2015) Global Temperature
- Rapid, Climate-Informed Development Needed to Keep Climate Change from Pushing More than 100 Million People into Poverty by 2030 (WB 2015) |
- 2015 and 2016 set to break global heat records, says Met Office (Sept 2015)
- Bloomberg: What’s really warming the world?
- Global Warming ‘Hiatus’ Never Happened, Scientists Say (Sept 2014)
- The Next Genocide (NYT Sept 2015)
- Welcome to a New Planet: Climate Change ‘Tipping Points’ and the Fate of the Earth (Oct 2015)
- Climate apocalypse is here now: science fiction has become our new reality (Oct 2015)
- Long-Awaited ‘Jump’ In Global Warming Now Appears ‘Imminent’ (April 2015) |
- WMO: Warming trends continue in 2014 (Feb 2015)
- 2014 Global Temperature Recap (NOAA, Jan 2015)
- NASA/ GISS Surface Temperature Analysis
- World Scientists: Climate Change as Serious a Risk as Nuclear War (July 2015)
- 2014 one of the warmest years on record globally (Metoffice Jan 2015)
- 2014 warmest year in modern record (NASA, Jan 2015)
- 2014 Was the Hottest Year on Record (Ecowatch Jan 2015)
- The oceans are warming so fast, they keep breaking scientists’ charts (Guardian Jan 2015)
- The 10 warmest years: Not exactly forever ago (NASA Jan 2015)
- Climate science, awareness and solutions (Columbia univ. Jan 2015)
- Leave most fossil fuels in the ground, or fry (Ecologist, Jan 2015)
- Turn down the heat – World Bank Nov 2014
- IPCC Synthesis report 2014
- UN Scientists See Largest CO2 Increase in 30 Years (Sept 2014)
- IPCC (2013) Climate change. The physical science basis
- The Grantham institute on the climate and the environment
- World’s Scientists Warn: We Have ‘High Confidence’ In The ‘Irreversible Impacts’ Of Climate Inaction
- NOAA: Global Analysis – Annual 2014
- NASA Climate
- Global climate dashboard (NOAA)
- Climate change (World Bank)
- Cowtan and Way (2014): Surface temperature data update
- National Academies: A Discussion on Climate Change: Evidence and Causes (March 2014)
- AAAS 2014: What we know
- Keeling curve
- NASA: scientific consensus
- Thoughts on 2014 and ongoing temperature trends
- Groundhog Decade: We’re Stuck In A Movie Where It’s Always The Hottest Decade On Record
- Satellite Images 1 Year Apart Paint Grim Picture Of Sierra Snowpack
- No, Climate Change Is Not Experiencing a Hiatus (Feb 2015)
- Global warming’s influence on extreme weather
- 3 Connections Between Climate Change and Extreme Weather
- Global warming doubles risk of extreme La Niña event, research shows
- Extreme weather of last decade part of larger pattern linked to global warming
- Summer storm weakening leads to more persistent heat extremes (March 2015)
- Cowtan og Way: Coverage bias in the Hadcruth temperature series
- Climate change: why the Guardian is putting threat to Earth front and centre
- 6 Devastating Heat Waves Hitting the Planet
- Why Are Climate Groups Only Focused on 50% of the Solution?
- Call for a Future Powered by 100% Renewables Gains Momentum as UN Climate Talks Resume in Bonn (Aug 2015)
- This Is What the World Will Look Like After Climate Change
- Finding hope within the doom and gloom of climate change (Nov 2015)
- Climate activist Tim Flannery looks at world’s next seven years (Nov 2015)
- Energy game changers look to the future. Researchers now know how to keep the whole of the US powered by wind, water and sunlight without ever needing to fall back on emergency fossil fuel generators (Dec 2015)
Pollution
- Smog So Thick, Beijing Comes to a Standstill (NYT Dec 2015)
- Global is the new local: Pollution changes clouds, climate downstream (NASA, Jan 2015)
- Beijing Issues First-Ever ‘Red Alert’ Over Air Pollution (Dec 2015)
- Worldwide Air Pollution Deaths Per Year Number Over 2 Million
- Pollution could kill 6.6m people a year by 2050 (Sept 2015)
- Smog in Asia
- City of light dims: smog in Paris (March 2014)
- WHO: 7 million deaths annually linked to air pollution (March 2014)
- The toxic truth about air pollution: a lethal scandal of British inaction (April 2014)
- China’s Air Pollution Behind Erratic Weather in the U.S., say Climatologists (April 2014)
- Urban air is getting so dirty, 7 out of 8 people breathe air that fails to meet WHO safe levels
- India’s ‘Airpocalypse’ (March 2015)
- Geo engineering SRM
- Big Oil: Masters of Deception and Inhumanity
- How an ExxonMobil-Funded Think Tank Took Over a Scientific Journal
- Who’s Behind the Attack on the Pope’s Climate Encyclical?
- New Report Exposes Dark Money Funneling to Climate Change Denial Groups (June 2015)
- China’s Communist-Capitalist Ecological Apocalypse. China has to change and transform into greener economy (Aug 2015)
- Climate Crisis, the Deindustrialization Imperative and the Jobs vs. Environment Dilemma
Oceans in trouble
- The oceans are warming so fast, they keep breaking scientists’ charts (Skeptical science Jan 2015)
- James Hansen: ‘Emergency Cooperation Among Nations’ Is Needed to Prevent Catastrophic Sea Level Rise (July 2015)
- Sea Levels Could Rise at Least 20 Feet (July 2015)
- Unabated global mean sea-level rise over the satellite altimeter era (Nature, May 2015
- Coral reefs about to crash in a big way (jan 2015)
- Ocean acidification
- Global carbon emissions set to reach record 36 billion tonnes in 2013 (Tyndall centre)
- Ocean acidification fact sheet
- Life With rising seas
- .Sea Level Rise Making Floods Routine for Coastal Cities
- ‘The Other CO2 Problem’: How Acidic Oceans Will Cost Our Economy Billions (Oct 2014)
- Science chief warns on acid oceans (BBC Oct 2014)
- Ice melt, sea level rise and superstorms: evidence from paleoclimate data, climate modeling, and modern observations that 2◦C global warming is highly dangerous
- Say Goodbye to Coastlines: New Study Warns of Disastrous Sea Level Rise Within Decades (July 2015)
- Climate change will destroy the planets circulatory system
Correlation between CO2 and climate change
- New measurements confirm extra heating from our carbon dioxide (March 2015)
- Feldman et al(2015) Observational determination of surface radiative forcing by CO2 from 2000 to 2010. (Nature March 2015)
- Looming Warming Spurt Could Reshape Climate Debate
- Climate impact of increasing atmospheric carbon dioxide
- CO2 as a primary driver of Phanerozoic climate
- IPCC: Introduction to climate science
- Correlation CO2 and warming
- Causes of climate change (US EPA)
- WMO: The global climate 2001-2010
- 2014 on course to be one of hottest, possibly hottest, on record. Exceptional heat and flooding in many parts of the world (WMO Dec 2014)
- Hansen, J. et al (2005) Earth’s Energy Imbalance: Confirmation and Implications (Science)
- Virgin earth challenge: Removing greenhouse gases from the atmosphere
- IPCC (2007) Pre-Quaternary climates prior to 2.6 Ma were mostly warmer than today and associated with higher CO2 levels
Economies in transition
- Joseph Stieglitz: As the Climate Goes, So Goes the Economy
- Global Leaders on Pace to Rescue the Climate (Jan 2016)
- Paul Krugman: More about renewables (Feb 2016)
- Krugman, IMF: Fighting Global Warming Is ‘Cheap’ And ‘Might Actually Lead To Faster Growth’
- Stern Review: The Economics of Climate Change
- World Bank: Climate change overview
- World Bank: New Study Adds Up the Benefits of Climate-Smart Development in Lives, Jobs, and GDP
- World Bank: Climate change
- World Bank: World Is Locked into ~1.5°C Warming & Risks Are Rising
- Climate change more catastrophic for the global economy than we thought (Oct 2015)
- End Fossil Fuel Subsidies Now and Start Carbon Tax, Urges World Bank Chief
- Fossil fuels subsidised by $10m a minute, says IMF
- World Bank: Putting a price on carbon would help economies
- World Bank rejects energy industry notion that coal can cure poverty
- IMF Experts and Others Envision a World without Energy Subsidies.
- What the U.S. Should Learn from Russia’s Collapse
- Bank of England investigating risk of ‘carbon bubble’ (Guardian Dec 2014)
- Bank of England prods insurers about climate plans (FT Dec 2014)
- Bank of England Says Climate Change Research ‘Absolutely Essential’ After Attack From Climate Denier Lord Lawson (March 2015)
- Disclose climate risk in fossil fuel investments, says UK minister
- The Role of the 2015 Agreement in Mobilising Climate Finance
- What if Norwegian oil economy is a bubble?
- Lord Stern Report: Transform Global Economy to Fight Climate Change
- Green economy
- Dietz, S. & Stern, M. (2014) Endogenous growth, convexity of damages and climate risk (Grantham work paper)
- In the USA the fossil fuel fee-and-dividend stimulates the economy, modernizes infrastructure and saves 13,000 lives per year via improved air quality. GDP increases, with fee-and-dividend causing a cumulative GDP increase of $1.375 trillion.
- Solar Power is at a Tipping Point (The Upshot is Massive Profits) Money morning, Jan 2015
- Let there be light (Economist Jan 2015)
- Seize the day! The fall in the price of oil and gas provides a once-in-a-generation opportunity to fix bad energy policies (Economist Jan 2015)
- Changing financing – financing change UNEP-FI
- Why We Need to Stop the Fast Track of Our Future to Global Corporate Rule (March 2015)
- The Real Story Behind the Oil Price Collapse (March 2015)
- 10 Things You Need to Know About Oil Prices
- Why Fossil Fuels Are Dirty Politics as Well as Dirty Energy
- Public Utilities Should Embrace Renewable Energy Revolution, Not Get Run Over By It
- Lester Brown: The Great Energy Transition to Solar and Wind Is Underway
- Renewables Beat Fossil Fuels Second Year in a Row
- Renewable energy redoubles its global reach (June 2015)
- A Clean Energy Future: Why It Pays to Get There First (July 2015)
- IMF chief seeks climate breakthrough at Lima meet (Oct 2015)
- World Bank and IMF stress urgency of climate action (Oct 2013)
- World Bank cash for fossil fuels: The worst kind of hypocrisy (Apr 2015)
- An Economist Explains How Money Has Caused the Climate Crisis.The economy is undergoing a structural crisis for two reasons: greenhouse gas emissions and the income gap. (Oct 2015)
The Arctic and the Antarctic
- NOAA Arctic report card
- NASA Arctic sea ice
- “Arctic Matters: The Global Connection to Changes in the Arctic” National Research Council of the National Academies (2016)
- Another headline to get used to reading: Greenland ice may be melting faster than previously thought (Jan 2016)
- There is something odd and ominous afoot in Greenland. Did a huge melt water pulse occur 1-16-16? (Jan 2016)
- Arctic Sea Ice Levels Hit Record Low After Unusually Warm January (Feb 2016)
- Threat of Sea Level Rise Intensifies as Antarctica’s Melting Ice Sheet at ‘Point of No Return’ (Feb 2016)
- NASA: 2015 Arctic sea ice maximum is lowest recorded (March 2015)
- World’s Glaciers Melting at Record Rate (Aug 2015)
- Study: Melting Ice in West Antarctica Could Raise Sea Levels by 3 Meters (Nov 2015)
- Is Antarctica Actually Gaining Ice? (Nov 2015)
- Climate Elevator Pitch: Glaciologist Eric Rignot (Nov 2015)
- New NASA Video: Massive Greenland Glacier on the Move (Dec 2015
- Study predicts Antarctica ice melt if all fossil fuels are burned (NYT Sept 2015)
- Watch NASA Explain Why We Should All Be Worried About Greenland’s Melting Ice Sheet (Sept 2015)
- No longer considered an extreme event! Mega Icebergs are wreaking havoc in the Southern Ocean (Oct 2015)
- Predictions Implicit in “Ice Melt” Paper and Global Implications (Hansen, Sept 2015)
- Arctic Sea Ice Hits Annual Minimum, 4th Lowest on Record (Sept 2015)
- U.S. Is Seen as Laggard as Russia Asserts Itself in Warming Arctic (NYT Aug 2015)
- The great Arctic thaw could unleash giant viruses (Sept 2015)
- West Antarctic ice sheet falling apart (NYT, May 2014)
- Are You Ready for the Biggest Environmental Catastrophe of Our Lifetime? West Antarctica melting (April 2015)
- Melting Antarctic Glacier Unstoppable, Global Sea Level Could Rise by 4 Feet
- Record decline of ice sheets: For the first time scientists map elevation changes of Greenlandic and Antarctic glaciers (Aug 2014)
- Sudden drainage, via massive chasm, of Subglacial lakes in Greenland described as catastrophic (Sept 2015)
- Regional acceleration in ice mass loss from Greenland and Antarctica using GRACE time-variable gravity data
- Scientists Weigh New Evidence on Antarctic Ice Melt (May 2015)
- Massive Antarctic Ice Shelf Will Disappear Completely In A Few Years, According To NASA (May 2015)
- Sea Levels Could Rise at Least 20 Feet (July 2015)
- Greenland Ice Sheet more vulnerable to climate change than previously thought(Sept 2014)
- Changing Antarctic waters could trigger steep rise in sea levels, conditions 14,000 years ago suggest (Oct 2014)
- Earth’s Oceans Heating Up Much Faster Than Scientists Expected (Oct 2014)
- ‘The Day After Tomorrow’ Ice Age Scenario Could Be Possible, Researchers Say
Possible climate change impacts on ocean currents
Droughts, floods, weather extremes, glaciers
- Chinese Glacier’s Retreat Signals Trouble for Asian Water Supply (NYT Dec 2015)
- 5 Extreme Weather Events Devastating the Planet (Oct 2015)
- Global warming’s fingerprints are all over recent extreme weather, research shows (Nov 2015)
- Storm Desmond: Aerial footage shows extent of flooding damage in Cumbria (Dec 2015)
- Storm Desmond – by numbers (Dec 2015)
- Is climate change to blame for Typhoon Haiyan?
- Poorest hit hardest by south India floods
- Hurricane Patricia dissipates in Mexico; flooding, mudslide concerns remain (Oct 2015)
- Buckle Up: Scientists Warn of Dozens of Global Warming Tipping Points That Could Trigger Natural Disasters (Oct 2015)
- Bushfires, heatwaves and early deaths: the climate is changing before our eyes (Guardian Aug 2015)
- Thousands forced to flee their homes after Japan experiences unprecedented rainfall (Sept 2015)
- The role of climate change in Utah’s and Arizona’s deadly floods (Sept 2015)
- Flooding Cripples South Carolina Where Some Areas See Over a Foot of Rain (NYT Oct 2015)
- Record Rainfall Hits Vegas, 15 Dead in South Carolina’s Historic Flooding (Oct 2015)
- Humans to Blame for Catastrophic Drought in California, Scientists Say (Aug 2015)
- Thirst Turns to Desperation in Rural California (NYT Feb 2015)
- Extreme weather already on increase due to climate change, study finds
- Extreme weather (video)
- How much of California’s drought was caused by climate change? Scientists now have the answer (Aug 2015)
- Anthropogenic contribution to global occurrence of heavy-precipitation and high-temperature extremes (Nature, April 2015)
- Climate Change Caused California Drought (April 2015)
- India heat wave eases after nearly 1,700 deaths (BBC May 2015)
- Global Warming May Increase Extreme ‘Grey Swan’ Hurricanes
- Alaska’s Heat Wave Ignites Fires as Glaciers Rapidly Melt (June 2015)
- Pakistan heat wave: Death toll passes 700 in Karachi, Sindh Province (CNN, June 2015)
- Western Europe shatters temperature records during multiday heatwave (July 2015)
- Death Toll Climbs as Weather Experts Link Pakistan Heatwave to Climate Change (July 2015)
- 5 Extreme Weather Events Impacting the Planet (July 2015)
- Welcome to an extreme, warming world (July 2015)
- World’s Glaciers Melting at Record Rate (August 2015)
- California Drought Is Made Worse by Global Warming, Scientists Say (NYT Aug 2015)
- Limits to climate adaptation in Uganda
- Climate change in the Fertile Crescent and implications of the recent Syrian drought (PNAS 2014)
Climate Refugees
- Think Today’s Refugee Crisis is Bad? Climate Change Will Make it a Lot Worse (July 2015)
- The Marshall Islands Are Disappearing (NYT Dec 2015)
- Climate and laws trap islanders (Dec 2015)
- Why ISIS Wants the Paris Climate Talks to Fail (Nov 2015)
- Paris, the Refugees and Europe (Nov 2015)
- Worried about refugees? Just wait until we dust-bowlify Mexico and Central America (Sep 2015)
- Will climate change spark an Asian migrant crisis? (Oct 2015)
- Bernie Sanders: ‘Climate Change Is Directly Related to the Growth of Terrorism’
- “Climate Change War” Is Not a Metaphor
- Pentagon Says Global Warming Poses an Immediate Risk to National Security. Climate change a threat multiplier
- Pentagon: Global Warming Poses ‘Immediate Risk’ To National Security
- Immigration and Terrorism Will Increase With Climate Change, Says Military Leader
Debunking the “skeptics”
- List of Worldwide Scientific Organizations That Hold the Position That Climate Change Has Been Caused by Human Action
- New Study Exposes True Extent, Influence Of Climate Denial Echo Chamber For First Time (Dec 2015)
- Exxon’s climate lie: ‘No corporation has ever done anything this big or bad’ (Guardian, Oct 2015)
- Climate Denying GWPF Academic Chairman Ross McKitrick Resigns In Wake of Greenpeace Sting (Jan 2016)
- Study Finds The ‘Era of Climate Science Denial Is Not Over’ (Jan 2016)
- Why They Lost- Climate Denial Becomes A Stand-up Comedy Routine
- Over to renewables – now!
- Exxon knew of climate change in 1981, email says – but it funded deniers for 27 more years
- Senator Inhofe to Climate Deniers: ‘You’re Doing the Lord’s Work’
- Busted: Academics-for-Hire Exposed for Failing to Disclose Fossil Fuel Funding (Dec 2015) |
- Obama Slams Koch Brothers at Clean Energy Summit for ‘Standing in the Way of Progress’ (Aug 2015)
- Koch Brothers + 11 Other Special Interest Groups Wage War on Solar (Oct 2015)
- Smoke, Mirrors & Hot Air How ExxonMobil Uses Big Tobacco’s Tactics
to Manufacture Uncertainty on Climate Science-
- Internal Documents Show Fossil Fuel Industry Has Been Aware of Climate Change for Decades (Huffignton Post Aug 2015)
- Exxon’s climate lie: ‘No corporation has ever done anything this big or bad’ (Guardian, Oct 2015)
- Exxon’s Own Research Confirmed Fossil Fuels’ Role in Global Warming Decades Ago
- Make 2015 a climate year – on our way to Paris
- Climate change has happened before. So why worry?
- The Climate-gate story – the real scandal
- Two or three degrees more – does it really matter?
- Out of fossil fuels now!
- Cocksure statements on climate change?
- Climate change in facts and figures
- Winter is cold. Global warming canceled?
- It’s just natural variation – isn’t it?
- It’s the volcanoes – or is it?
- The carbon mafia and climate “sceptics”
- Natural disasters – Acts of God or human culpability?
- How to Defeat the Science Deniers: Even Wingnuts Learn That Reality is Good Business
- Are the facts catching up with right-wingers?
- Infographic: Climate Science vs. Fossil Fuel Fiction
- What the ‘Merchants of Doubt’ Don’t Want You to Know
- New Report Exposes Dark Money Funneling to Climate Change Denial Groups (June 2015)
- The World’s Deadliest Place for Kids – oil rich Angola
- Watch Bill Nye Shred Climate Denying Congresswoman
- Goodbye Coal, Hello Renewables, Thanks to Advocates Work Retiring Dirty Plant + Google’s New Data Center
- Let Them Eat Climate Change (July 2015)
- Halpern, M. (2015) Freedom to Bully How Laws Intended to Free Information are Used to Harass Researchers
- Halpern. M. (2015) Digging into big coal’s climate connections – The bankruptcy filings of a Virginia coal firm have shone a rare light on a murky web of corporate attacks on climate science.
Some politicians are waking up
- Ban Ki Moon: Now Is the Time to Act on Climate Change
- Presidential Candidate Martin O’Malley: We Can and Should Be 100% Powered by Renewable Energy by 2050
- Obama Slams Koch Brothers at Clean Energy Summit for ‘Standing in the Way of Progress’ (Aug 2015)
- Al Gore: New thinking on the climate crisis
- Obama: No Challenge Poses a Greater Threat Than Climate Change
- Republicans Speak Out in Support of Renewable Energy and Against Fossil Fuel-Funded Climate Deniers
- President Obama: Some in Congress Are ‘Shills for the Fossil Fuel Industry’
- Climate reality training with Al Gore
- China’s Anti-Pollution Drive Starts to Bite on Sales of Coal ( Bloomberg’s July 2015)
Some top military ranks wake up
- TEDxPentagon – Rear Admiral David Titley, USN – Climate Change
- “Climate Change War” Is Not a Metaphor
- Pentagon Says Global Warming Poses an Immediate Risk to National Security. Climate change a threat multiplier
- Pentagon: Global Warming Poses ‘Immediate Risk’ To National Security
- Immigration and Terrorism Will Increase With Climate Change, Says Military Leader
- Climate Change Is ‘Perhaps The World’s Most Fearsome Weapon Of Mass Destruction’
- The U.S. Navy Just Announced The End Of Big Oil And No One Noticed (April 2014)
- Pentagon unveils plan for military’s response to climate change (LA Times Oct 2014)
- Prince Charles: rewire the global economy to stop climate change
Energy companies trying to change?
- How the European Oil Industry Decided to Save the Climate
- Fossil fuel firms risk wasting billions by ignoring climate change, says IEA
- Shell Leaves ALEC, Improves Consistency on Climate Lobbying
Deniers’ corner
- U.S. Supreme Court Refuses to Block Exxon Climate Fraud Investigation (2019)
- Fossil fuel firms are still bankrolling climate denial lobby groups
- Trump, Putin, and ExxonMobil team up to destroy the planet (Dec 2016)
- Documenting the Fossil Fuel Industry’s Climate Deception (Union of concerned scientists July 2015)
- Why are so many Americans skeptical about climate change? A study offers a surprising answer (Wash post Nov 2015)
- Exxon Advertised Against Climate Change for Decades After Top Executives Knew Burning Fossil Fuels Would Warm the Planet (Sept 2015)
- The Climate Deception Dossiers (Union of concerned scientists July 2015)
- Internal Documents Expose Fossil Fuel Industry’s Decades of Deception on Climate Change
- Climate denial is corruption and the GOP is captured by it (Sept 2015)
- How extreme energy leads to extreme politics Big oil vs indigenous peoples in Argentina (Sept 2015)
- Papal Smackdown: Pope Francis v. Fossil Fuel Execs (Sept 2015)
- Pope Francis’ Encyclical Urges Swift Action on Climate Change Ahead of Paris Climate Talks
- Pope Francis Condemns Multinational Corporations for Choosing Profit Over People
- This group is waging war on the Pope’s climate change plans
- Climate change skeptic accused of violating disclosure rules
- Perpetuating the Reign of Carbon:The major energy companies have gone on the offensive, minimizing the potential for renewables in the imaginable future
- Kochs and Walmart Clan Wage Dirty War to Stop You From Putting Solar Panels on Your Home
- The war on solar
- Suzuki – Get real on climate change (1) | The war on climate scientists (2)
- 11 Things The Koch Brothers Don’t Want You To Know, From Robert Greenwald’s Newly Updated Documentary
- Koch Bros exposed 2014
- Calls For Media To Accurately Label Climate Deniers Growing Louder
- Climate denial gets a billion dollar boost by the Kochs
- Mashey Report Confirms Heartland’s Manipulation; Exposes Singer’s Deception
- How Tobacco Shills Inspired Climate Denial
- Last Week Tonight with John Oliver: Tobacco (HBO)
- The secret bribes of big tobacco (BBC, Nov 2015)
- How a Tobacco-Funded Think Tank Recruited Scientists in the Attack Against Climate Change (Feb 2015)
- Britain’s First Climate Denier Was Bag Carrier for Oil Baron Charles Koch
- The Secret Love Affair Between Roger Bate and Big Tobacco
- What You’ve Always Been Getting Wrong About Big Tobacco Funding Climate Deniers
- Climate Denier’s Funding from Fossil Fuel Industry Exposed at a Staggering $1.25 Million (Feb 2015)
- Koch Brothers, ExxonMobil and Big Coal Fund Climate Denier Scientist Willie Soon
- HBO’s Award-Winning VICE Exposes Climate Deniers and the Dire Consequences of Sea Level Rise (March 2015)
- Now They’re Saying It in Public: Professor At Koch-Funded University Department Calls For ‘Less Democracy’
- Fossil fuel industry caught taking a page out of the tobacco playbook (March 2015)
- “Merchants of Doubt”: Meet the sleazy spin doctors who will stop at nothing to obscure the truth (March 2015)
- How the Media Fails to Explain the Basic Science that Proves Climate Change (March 2015)
- Merchants of Doubt: What Climate Deniers Learned from Big Tobacco
- Climate Deniers Exposed: Top Scientist Got Funding from ExxonMobil, Koch Brothers, Big Coal
- Koch Brothers EXPOSED: 2014 • FULL DOCUMENTARY • BRAVE NEW FILMS
- Tobacco Gun for Hire James Enstrom, Willie Soon and the Climate Deniers Attack on Merchants of Doubt
- David Suzuki: Koch Brothers Continue to Oil the Machine of Climate Change Denial (April 2015)
- How an Environmental Journalist Became an Apologist for the Fossil Fuel Industry
- Will Chevron and Exxon Ever Be Held Responsible for Decades of Contamination?
- Here We Go Again: Koch Cronies ‘Cook the Books’
- Florida’s state workers silenced on climate change (March 2015)
- Hilarious: state employees not allowed to say “Climate Change”, “Global warming” and “Sea level rise” in a state that is seriously threatened by sea level rise and global warming.
- Hedge Fund King is Bankrolling World’s Leading Climate-Science Denier
- Solar industry prepares for battle against Koch brothers front groups
- Rupert Murdoch’s Newspapers Mislead Public On Climate Change and Environment (DeSmog Blog)
- Dollars for Deniers: Big Oil Funds Climate Science Denialism (Daily Kos)
- The 5 stages of climate denial are on display ahead of the IPCC report (The Guardian)
- Secret funding helped build vast network of climate denial thinktanks
- The ATM for climate deniers
- ‘Reality Drop,’ Climate Change Social Media Website Unveiled By Al Gore, To Take Down Deniers

You state: “What they “forget” to tell you is that what counts are greenhouse gases, less than 1% of the air. Then CO2 is highly significant. ” I thought that water vapour could range from 0.1 to 4percent of the atmosphere?
LikeLike
yes. the range is from insignificant to around 4%. Average content is around 1%, depending a bit on how you calculate.
The interesting issue in this context is that atmospheric (tropospheric) water vapor increases by 5-7% for each grade Celcius increase in average global temperature. The water vapor feedback is thus one of the big feedback mechanisms that can cause a run-away greenhouse effect. Anthropogenic emissions alone can probably not do that. See IPCC report: http://www.ipcc.ch/report/ar5/wg1/docs/WG1AR5_FAQbrochure_FINAL.pdf page 37
LikeLiked by 1 person
Reblogged this on Comunicação Ambiente Sustentabilidade.
LikeLike