
How to distinguish myths from realities, science from mere assumptions, conspiracy theories and propaganda? Serious research has an important tool: peer-reviewed articles published in scientific journals. This involves an editorial committee and at least two experts in the field considering the quality. They propose necessary improvements before publication. It is a laborious process. Most scientists have one or more times become annoyed to learn that the article did not add new knowledge or that source material was incomplete.
Researchers who do not publish peer-reviewed articles, lose status. Some of those who do not get published in scientific journals tend to believe that such articles are unreliable and overvalued.
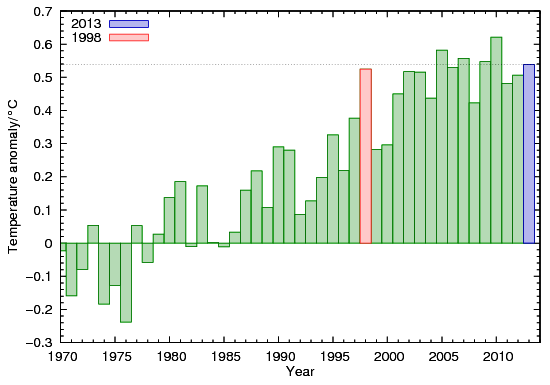
Climate deniers have difficulties publishing in scientific journals because they use sources like the Heartland- or Cato institutes. These sources are financed by the world’s largest oil companies, carbon barons like David and Charles Koch and the American big tobacco industry. These institutes claim that we have been in a “warming pause” or hiatus since 1998. This is an example of “cherrypicking”. The author picks out the information that fits, while ignoring the rest. Cherrypicking guarantees that you will not be able to publish your article in a scientific journal.
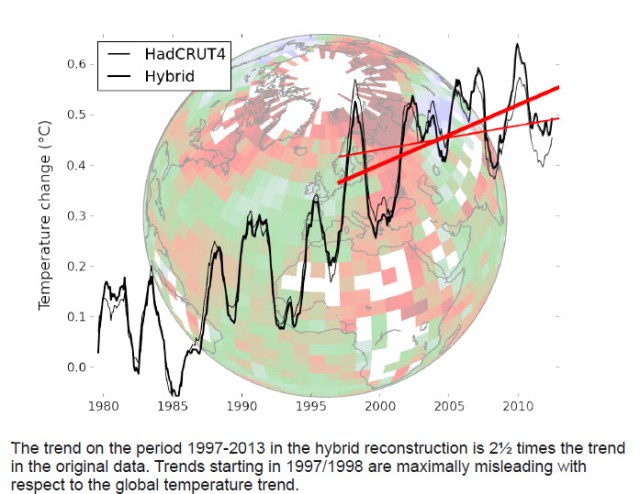
Annual temperature variations are variations in weather. Climate is average parameters over 30 years. Focusing on one year is unscientific cherry-picking. The last three decades have seen a clear warming trend, despite low solar activity. https://www.skepticalscience.com/cowtan_way_surface_temperature_data_update.html
The picture shows why 1998 is “cherrypicking”: it is an extreme year, the warmest year during the last century, with unusual solar activity and the strongest El Nino in a hundred years. Choose 1992 or 1985 instead, and you see that the warming has been dramatic.
Serious climate research does not use a single year as a starting point, but average temperatures over years. The meteorological Normal is the average weather in a place for 30 years and is an expression of climate. Weather is what happens in the moment or over a year or two. Using 1998 as a basis reference year when discussing climate change is mixing of weather and climate and is simply deceptive.
Warming pause?
Deniers claim that the IPCC cannot explain the “warming pause”. The reality is different. When warming of the atmosphere has not accelerated as much as expected with increasing concentrations of greenhouse gases, this has to do with the fact that global warming is simply not linear, low solar activity and dramatic increases of particles in the air from the burning of coal and oil, especially in Asia. In addition comes the cooling effect of many smaller volcanic eruptions. An active “Pacific Decadal Oscillation“, which is now coming to an end, has transported much of the extra heat into the deep sea.
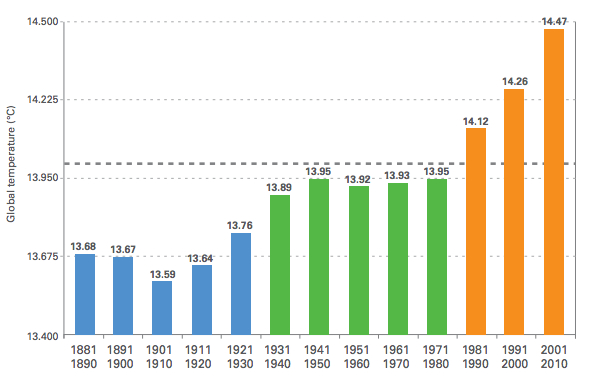
Global warming the last three decades has been dramatic. Source: World Meteorological Organisation, 2013 http://library.wmo.int/pmb_ged/wmo_1119_en.pdf
When deep sea warming is included and average temperatures are used in the calculations, there is no “warming pause” according to a report by the World Meteorological Organization in 2013. This is confirmed by Science 2015: “Data show no recent slowdown in global warming“.
- NOAA challenged the global warming ‘pause.’ Now new research says the agency was right (Jan 2017)
- Already Debunked Global Warming ‘Hiatus’ Gets Another Dunking (Jan 2017)
- NOAA: Study: Global Warming Hiatus Attributed to Redistribution
Deniers like to provide the public with imaginative claims about the IPCC research. In reality the IPCC does not do research of its own and has never done it. The IPCC reports on the research published in peer-reviewed scientific journals over five-year periods. The recent IPCC reports are based on 30 000 such articles, in turn based on empirical research. The reports are not dependent on models, as deniers like to claim. Models are based on the best available knowledge, are only a small part of the work, and give an idea of what might happen under various assumptions.
The IPCC says that only CO2 affects the climate, it is claimed. Those who take the trouble to read the reports will quickly find out that the IPCC operates with a plethora of factors as “driving forces” and that CO2 previously often had a reinforcing “feedback”-effect after other factors have started up a climate change. The IPCC has never said that CO2 always is the initiating temperature driver.
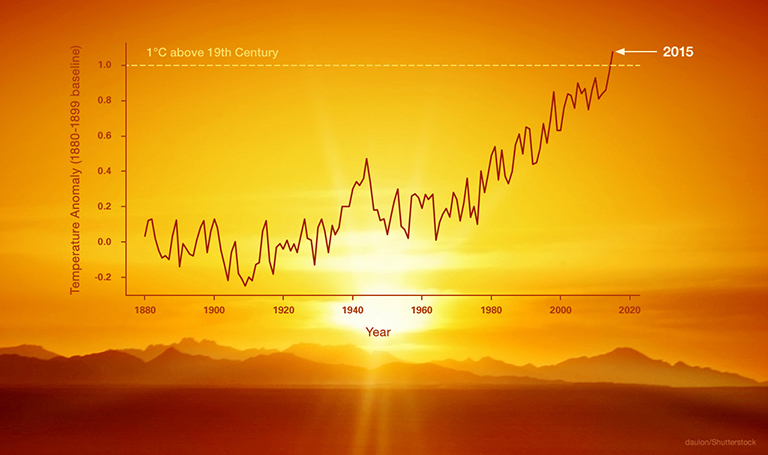
According to NASA, global average temperatures have developed as expected. However, we should expect a jump in the near future.

The “jump” in global temperature seems to take place in 2015-2016.
NASA has comprehensive long-term datasets on temperatures at GISS Surface Temperature Analysis (GISTEMP). NOAA National Climatic Data Center has similar datasets. The UK Met Office Hadley Centre also has long term temperature data sets. All instances conclude that the global average temperature undoubtedly has increased the last decades.
- 2016: one of the warmest two years on record (Met office Jan 2017)
A common claim from the fossil fuel propaganda industry is that the relationship between more CO2 and global warming has not been proven. A few decades ago the tobacco industry similarly claimed that cigarettes were good for you and that any connection between cigarette smoking and cancer was not proven. History repeats itself. In reality, several climate scientists have demonstrated how CO2 drives temperature. The most recent article appeared In this year’s March issue of Nature: Feldman and colleagues (2015) observational determination of surface radiative forcing by CO2 from 2000 through 2010.
Natural forcing alone can not explain the graphic below. Natural forcing, cooling aerosols, ocean currents and increases in greenhouse gases must all be included. The data are all direct measurements and not related to models.
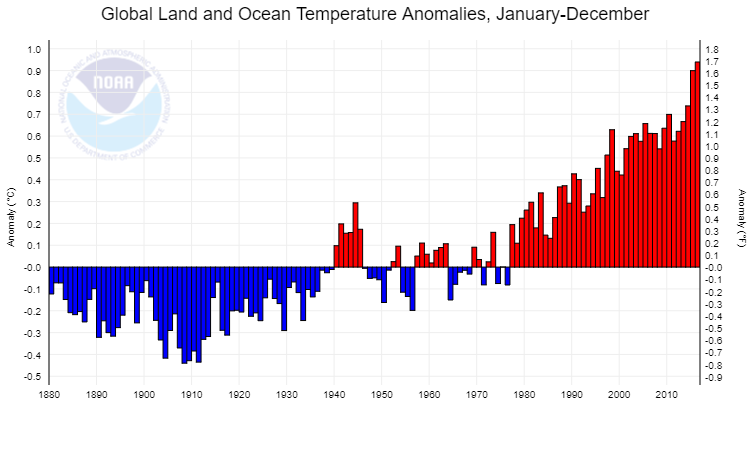
This marks the fifth time in the 21st century a new record high annual temperature has been set (along with 2005, 2010, 2014, and 2015) and also marks the 40th consecutive year (since 1977) that the annual temperature has been above the 20th century average. To date, all 16 years of the 21stcentury rank among the seventeen warmest on record (1998 is currently the eighth warmest.) The five warmest years have all occurred since 2010.
Overall, the global annual temperature has increased at an average rate of 0.07°C (0.13°F) per decade since 1880 and at an average rate of 0.17°C (0.31°F) per decade since 1970.
One can always continue to discuss the “Pope’s beard” in perpetuity. But the elephant is still in the room: Daily we burn over 90 million barrels of oil and an equivalent amount of coal and gas. Annually we burden nature with between 30 and 40 billion tonnes of extra CO2 from fossil sources. The air pollution is fatal in many places. Our seas turn acidic. The climate in large parts of the world is changing, the ice edge in the Arctic is increasingly moving further north and Greenland and West Antarctica ice caps are melting. The capital accumulation with bloodthirsty petro-tyrants in the Middle East is huge, while oil-based economies are becoming increasingly vulnerable. Our ecological debt increases. New, renewable forms of energy are available, but under attack by international fossil industry.
It’s time to shelve the “skeptics” conspiracy theories, escapism and myths. We must begin the work for sustainable development and secure the future for our children. We’re late.
Mythmakers, climate and reality orientation
Over to renewables – now!
A Greener Future
Climate change in facts and figures
Why Do Many Reasonable People Doubt Science? (National Geographic March 2015)
Ten Clear Indicators Our Climate is Changing | Climate Reality
We Looked at 1,154 Climate Science Results and Found No Evidence of ‘Publication Bias’ (Oct 2017)
We’re Past the Point of No Return for Climate Change
Earth is in the danger zone, and every day we burn fossil fuels brings it closer to destruction.(Oct 2016)
No climate conspiracy: NOAA temperature adjustments bring data closer to pristine
A new study finds that NOAA temperature adjustments are doing exactly what they’re supposed to (Nov 2017)

A good, solid synopsis of our coming transformation. Excellent reading on the way to Paris.
LikeLike